What VCs Actually Want in Your Market Slide (2026)
Your market slide gets 30 seconds. Here's exactly what investors look for, what makes them skip, and how to build a slide that earns a second meeting.

VCs spend 3 minutes on your deck. Your market slide gets maybe 30 seconds.
In those 30 seconds, investors decide: "Is this market worth my time?"
Most founders waste this moment with a giant TAM number and zero context. The deck goes in the "no" pile. No meeting. No feedback. Just silence.
This guide breaks down exactly what VCs look for in a market slide, what triggers instant skepticism, and how to build a slide that earns the next conversation.
Why the Market Slide Matters More Than You Think
VCs aren't just evaluating your idea. They're evaluating the opportunity.
A brilliant product in a small market = lifestyle business. A decent product in a massive market = potential billion-dollar outcome.
The unspoken question: "If this team executes perfectly, how big can this get?" Your market slide answers that before you say a word about your product.
At pre-seed, you don't have revenue. You probably don't have users. The market slide is one of the few concrete things VCs can evaluate. Make it count.
The 6 Things VCs Look for in 30 Seconds
When a VC glances at your market slide, they're scanning for these elements:
1. A Number That Passes the Smell Test
VCs have pattern recognition. They've seen thousands of decks. A "$500B TAM" for a niche B2B tool triggers immediate skepticism.
The number should feel right for what you're building. A $2B market for vertical SaaS? Believable. A $200B market for a todo app? You've lost them.
2. How You Got There
Show your math. "450,000 potential customers × $24,000 ACV = $10.8B TAM" is infinitely more credible than just "$10.8B TAM."
Bottom-up calculations prove you understand your customer. Top-down numbers from Statista prove you can Google.
3. Sources They Can Verify
Unsourced numbers are opinions. VCs will check. Put your sources right on the slide: "Source: Census Bureau, Crunchbase, Gartner 2025."
Multiple sources that triangulate to similar numbers = credibility.
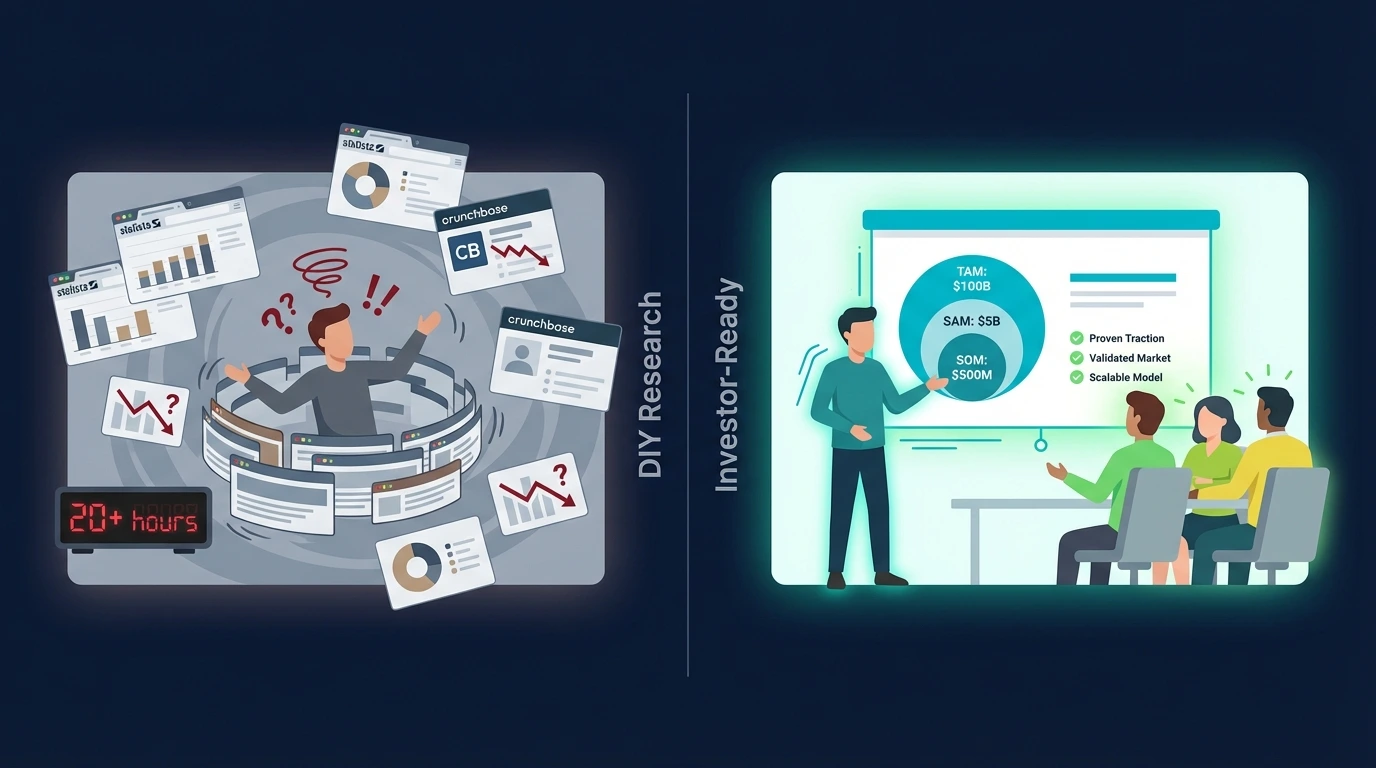
4. TAM → SAM → SOM Funnel
Total market, serviceable market, obtainable market. VCs want to see you've thought about focus, not just opportunity.
If your SAM equals your TAM, you haven't defined your beachhead. If your SOM is "1% of TAM," you haven't thought about go-to-market.
For a deeper dive on calculating these correctly, read our TAM SAM SOM guide.
5. Growth Rate
A $5B market growing 25% annually is more attractive than a $10B market growing 3%. Growth means tailwinds. Stagnation means fighting for existing share.
Include the CAGR (Compound Annual Growth Rate) and why the market is expanding.
6. Why Now
The timing question. Why is this market ready today when it wasn't 5 years ago? What changed?
- •New regulation creating demand
- •Technology breakthrough enabling new solutions
- •Behavioral shift (remote work, AI adoption, etc.)
- •Incumbent disruption opportunity
"Why now" separates good timing from wishful thinking.
What Makes VCs Skip Your Deck
These patterns trigger instant "no" decisions:
❌ The Fantasy Number
"$100B market opportunity" with no breakdown. VCs assume you grabbed the biggest number you could find and called it TAM.
❌ The Statista Screenshot
A pasted graph from a market research site. Zero original analysis. Shows you didn't do the work.
❌ The "1% Argument"
"If we capture just 1% of this $50B market..." VCs have heard this pitch 10,000 times. It's a red flag for lazy thinking.
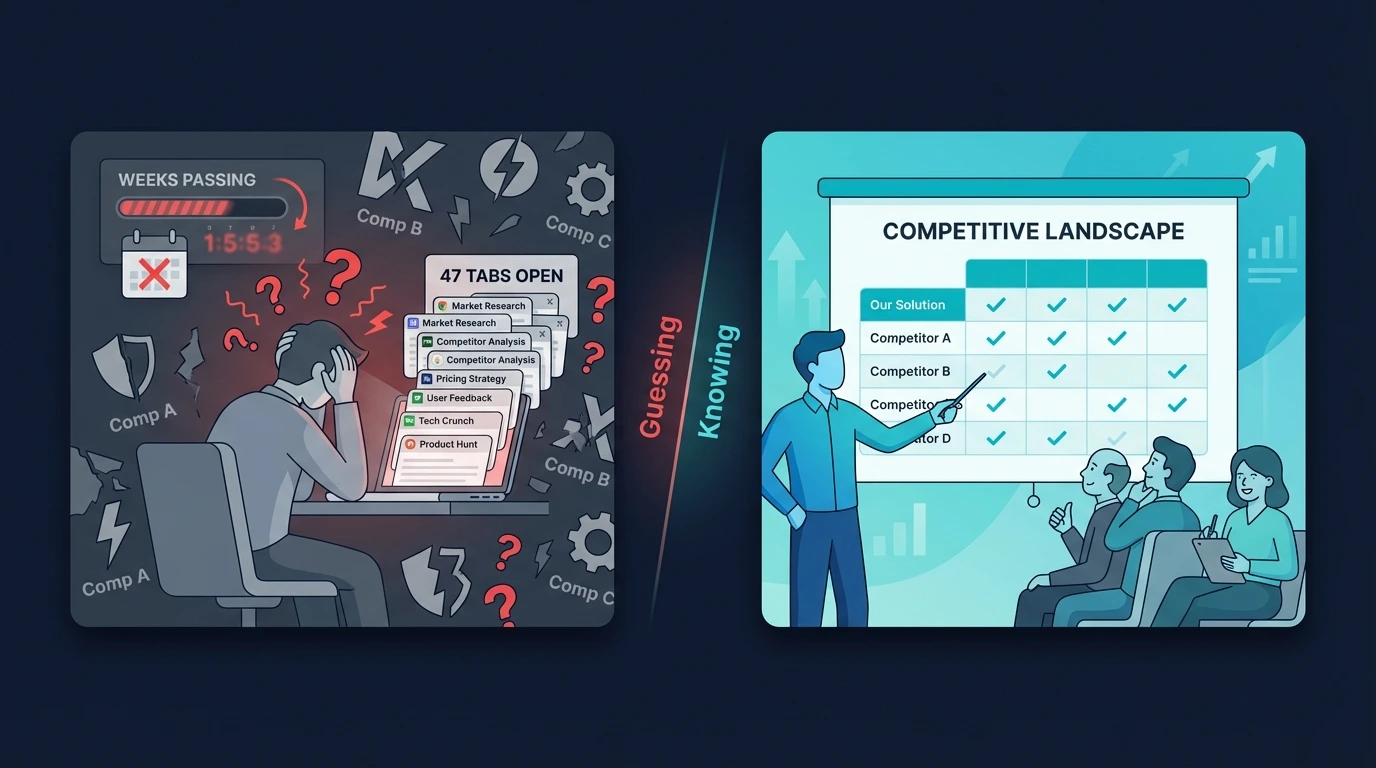
❌ No Competitive Context
A big market with entrenched competitors is harder than a smaller market with weak players. Market size without competitive landscape is incomplete.
❌ The Slide That Needs Explanation
If your market slide requires a 5-minute verbal walkthrough to make sense, it's failed. It should communicate in 30 seconds.
The Anatomy of a Great Market Slide
Here's the structure that works:
Header
"Market Opportunity" or "Why This Market" (not just "Market")
Visual: TAM → SAM → SOM
Nested circles or funnel showing the progression with dollar amounts
Calculation callout
Small text showing: "X customers × $Y ACV = $Z"
Growth indicator
"Growing 24% CAGR" with trend arrow
Why now bullet
One line on timing catalyst
Sources footer
"Sources: Gartner 2025, Census Bureau, Crunchbase"
One slide. Clean layout. Everything a VC needs to evaluate the opportunity at a glance.
Pre-Seed vs. Series A: Different Expectations
What VCs expect scales with stage:
| Element | Pre-Seed | Series A |
|---|---|---|
| TAM source | Industry reports OK | Primary research expected |
| SAM precision | Reasonable estimate | Customer data-backed |
| SOM validation | Logical GTM plan | Proven with early revenue |
| Competitive depth | Know the landscape | Win/loss data required |
| Growth proof | Market trend data | Your own growth rate |
At pre-seed, you're selling the opportunity. At Series A, you're proving you can capture it.
The Questions VCs Will Ask
If your market slide earns a meeting, be ready for these follow-ups:
"Walk me through your TAM calculation."
They want to see your math. Know your customer count, ACV assumption, and data sources cold.
"Who else is going after this market?"
Market opportunity means nothing without competitive context. Know your competitors, their funding, and their weaknesses.
"Why hasn't someone won this already?"
If the market is big and obvious, why is there room for a new entrant? Have a clear answer about timing or approach.
"What's your wedge?"
How do you enter this market? Which segment do you own first before expanding? VCs want to see focus.
"How does this market expand?"
Can you grow TAM through product expansion, geography, or adjacent use cases? Show the path from $2B to $10B.
Market Slide Checklist
Before you send your deck, verify:
- ☐TAM feels believable for what I'm building
- ☐Calculation is shown, not just the number
- ☐Sources are cited and verifiable
- ☐SAM reflects real constraints (geo, segment, etc.)
- ☐SOM ties to realistic go-to-market plan
- ☐Growth rate included with source
- ☐"Why now" is clear
- ☐Slide communicates in under 30 seconds
- ☐I can defend every number verbally
The Data VCs Actually Trust
Not all sources are equal. Here's the credibility hierarchy:
- ★★★Government data: Census Bureau, BLS, SEC filings. Hard to argue with.
- ★★★Your own customer research: Surveys, interviews, willingness-to-pay data.
- ★★☆Industry analysts: Gartner, Forrester, CB Insights. Respected but sometimes inflated.
- ★★☆Company databases: Crunchbase, PitchBook, LinkedIn. Good for company counts.
- ★☆☆Competitor public data: Pricing pages, press releases, job postings.
- ☆☆☆Generic market reports: Statista, random Google searches. Low credibility.
Use multiple sources that triangulate. If government data, Crunchbase, and Gartner all point to similar numbers, you're credible.
Frequently Asked Questions
Should the market slide come before or after the problem slide?
Usually after. Lead with the problem to build context, then show the market opportunity. Some founders flip this for massive markets that grab attention immediately.
How many market slides should I have?
One for most decks. If you're in a complex market, you might add a second slide for competitive landscape. Never more than two.
What if my market is genuinely small?
Show expansion potential. Start with your focused SAM, then show how you grow into adjacent markets. VCs invest in trajectories. Or accept that venture capital isn't the right funding for your business.
Do VCs actually verify the numbers?
Good ones do. They'll Google your sources during the pitch or in due diligence. Assume everything gets checked. If you can't defend a number, don't use it.
Should I include competitor logos on the market slide?
Save that for a dedicated competitive slide. The market slide should focus on opportunity size. Competitors are a separate (but related) conversation.
Related guides:
Build Your Market Slide in 60 Seconds
TestYourIdea pulls real market sizing, competitor data, and demand signals automatically. TAM/SAM/SOM with sources. The data slide VCs actually want to see.
Get Investor Data→Free preview. Full report $19. Real data, not guesswork.