TAM SAM SOM: How to Calculate Without Making It Up (2026)
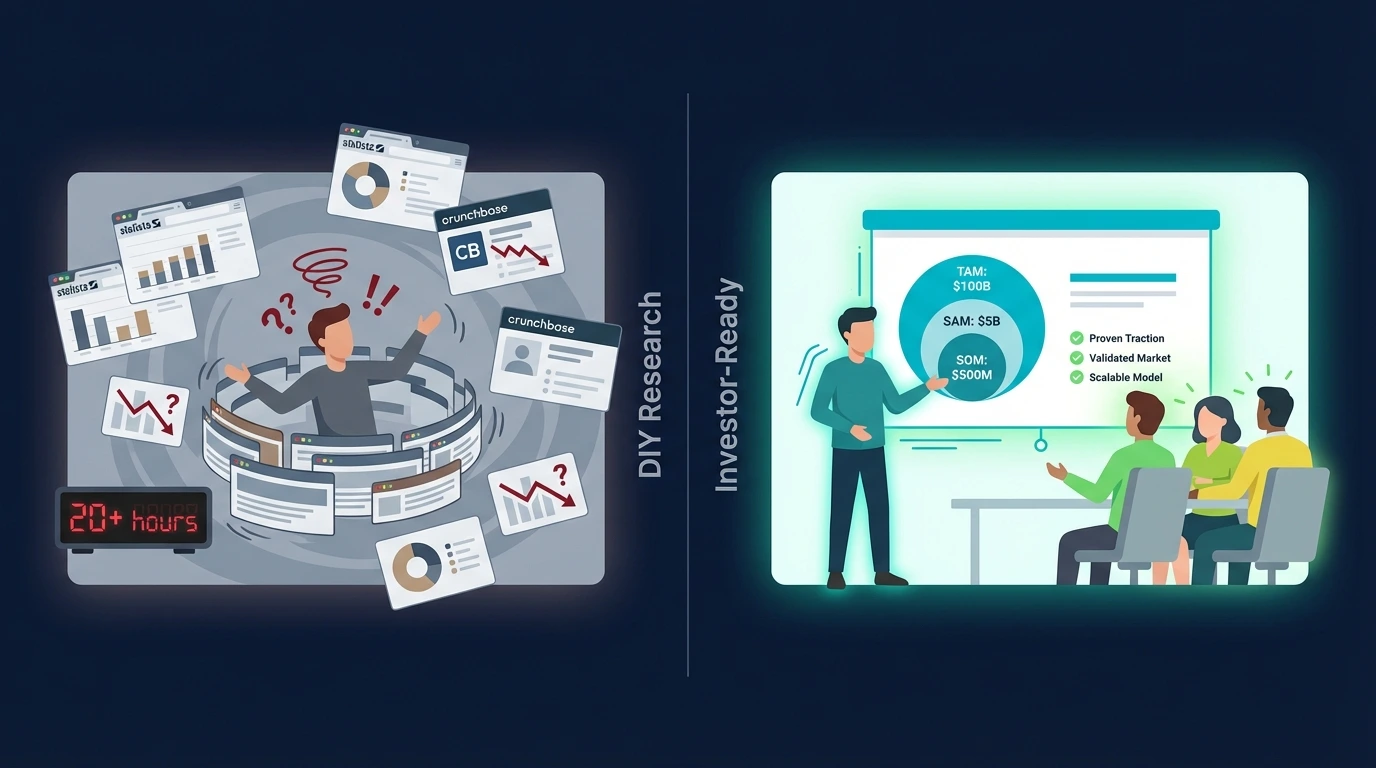
VCs see fake market sizes daily. Here's how to calculate TAM, SAM, and SOM with real data and sources they'll actually believe.

Every pre-seed deck has a market slide. Most of them are lies.
"TAM: $50B" with no source. A SAM pulled from thin air. A SOM that's conveniently 1% of a massive number.
VCs see this daily. They don't believe it. And when they don't believe your market slide, they don't believe the rest of your deck.
This guide shows you how to calculate TAM, SAM, and SOM with real numbers and real sources. The kind that survive due diligence.
What TAM, SAM, and SOM Actually Mean
Before the math, let's get the definitions right. Most founders mix these up.
TAM (Total Addressable Market)
The total revenue opportunity if you captured 100% of the market. Everyone who could theoretically buy your product.
SAM (Serviceable Addressable Market)
The portion of TAM you can actually reach with your business model. Limited by geography, segment, or distribution.
SOM (Serviceable Obtainable Market)
The realistic slice you can capture in 1-3 years. Your actual target, given competition and resources.
Think of it as a funnel. TAM is everyone. SAM is everyone you can reach. SOM is everyone you'll actually win.
Why VCs Care About Market Size
VCs need big outcomes. A $100M fund needs to return $300M+. That math only works if portfolio companies can reach $100M+ in revenue.
If your TAM is $500M and you capture 10%, that's $50M revenue. Good business. But not venture-scale.
The real question VCs are asking: "If this team executes perfectly, can this become a billion-dollar company?" Your market slide answers that question.
But here's the catch: VCs also have pattern recognition. They've seen thousands of decks claiming "$50B TAM" with nothing to back it up. Fake numbers trigger instant skepticism.
A credible $2B TAM beats an incredible $50B TAM every time.
The Wrong Way: Top-Down Fantasy Math
Here's how most founders calculate TAM:
The classic mistake:
"The global HR software market is $50B. We're building HR software. Therefore, TAM = $50B."
This is lazy and VCs know it. Problems with this approach:
- ✗You're not competing for the entire market
- ✗That $50B includes enterprise deals you'll never win
- ✗It includes geographies you won't enter for years
- ✗The number is from a Statista report the VC has seen 50 times
Top-down numbers feel big but mean nothing. VCs will challenge them, and you won't have answers.
The Right Way: Bottom-Up Reality Math
Bottom-up sizing starts with your actual customer, not a market report.
The formula:
Market Size = Number of Customers × Average Revenue Per Customer
That's it. Count the customers. Multiply by what they pay. Now let's apply it to TAM, SAM, and SOM.
How to Calculate TAM (With Sources)
Step 1: Define your customer.
Be specific. Not "businesses" but "B2B SaaS companies with 10-50 employees in the US." Not "consumers" but "homeowners aged 30-50 with household income above $100K."
Step 2: Count them.
Where to find customer counts:
- •US Census Bureau for demographic data
- •Bureau of Labor Statistics for industry employment
- •IBISWorld for industry reports
- •Crunchbase for company counts by segment
- •LinkedIn Sales Navigator for filtering by company size, industry, geography
Step 3: Determine annual spend.
What does your customer currently pay for solutions like yours? Check competitor pricing pages. Look at industry benchmarks. If you're creating a new category, estimate based on the budget they'd pull from.
Step 4: Multiply.
Example:
"There are 450,000 B2B SaaS companies globally (source: Crunchbase). Average spend on customer success tools is $24,000/year (source: Gainsight industry report)."
TAM = 450,000 × $24,000 = $10.8B
Notice the difference? Same number, but now defensible. You can explain where every figure came from.
How to Calculate SAM
SAM narrows TAM to the customers you can actually serve. Apply your real constraints:
- •Geography: US only? English-speaking markets? Global?
- •Company size: SMB only? Mid-market? Enterprise excluded?
- •Industry: Horizontal or vertical?
- •Technical requirements: Do they need specific integrations you support?
Continuing the example:
"We're starting with US-based SaaS companies with 20-200 employees (our ICP). That's 85,000 companies (source: LinkedIn Sales Navigator filter)."
SAM = 85,000 × $24,000 = $2.04B
SAM should be smaller than TAM. If your SAM equals your TAM, you're not being honest about your constraints.
How to Calculate SOM
SOM is the hardest because it requires honesty about competition and execution.
Two approaches:
Approach A: Market Share Estimation
Research what market share new entrants typically capture in your industry. For most B2B SaaS, a realistic year-3 target is 1-5% of SAM.
SOM = SAM × Realistic Market Share = $2.04B × 2% = $40.8M
Approach B: Customer Count Target
How many customers can you realistically acquire in 3 years? Be conservative. Factor in your sales capacity, marketing budget, and competitive dynamics.
"With 2 sales reps closing 3 deals/month at $24K ACV, we can reach 200 customers in year 3."
SOM = 200 × $24,000 = $4.8M ARR
VCs prefer Approach B because it shows you've thought about execution, not just market size.
Where to Find Credible Data Sources
Your sources matter as much as your numbers. Here's what VCs trust:
| Source Type | Examples | Credibility |
|---|---|---|
| Government data | Census, BLS, SEC filings | High |
| Industry associations | SaaStr, SIIA reports | High |
| Research firms | Gartner, Forrester, CB Insights | Medium-High |
| Company databases | Crunchbase, PitchBook, LinkedIn | Medium-High |
| Competitor data | Pricing pages, job postings, press releases | Medium |
| Generic market reports | Statista, random Google results | Low |
Pro tip: Cite multiple sources that triangulate to similar numbers. If Census data, Crunchbase, and an industry report all point to ~85,000 companies, your number is defensible.
Common TAM SAM SOM Mistakes
Mistake #1: TAM too big to be believable
"$500B market" for a niche B2B tool. VCs know you're inflating. A credible $5B TAM is better than an incredible $500B.
Mistake #2: SAM equals TAM
If you claim to serve everyone from day one, you haven't thought about focus. SAM should be 10-50% of TAM typically.
Mistake #3: SOM is exactly 1%
The lazy "1% of a big market" argument. VCs have seen it a thousand times. Calculate SOM from customer acquisition reality, not percentages.
Mistake #4: No sources cited
Numbers without sources are opinions. Always cite where your data came from. Put it right on the slide.
Mistake #5: Confusing revenue with GMV
If you're a marketplace taking 10% commission, your TAM is the commission pool, not total transaction volume. Don't inflate with GMV.
The Market Slide That Gets Second Meetings
Here's what a credible market slide includes:
- ✓TAM with calculation shown (not just the number)
- ✓SAM with clear constraints explained
- ✓SOM tied to realistic go-to-market
- ✓Sources cited (Gartner 2025, Census Bureau, etc.)
- ✓Growth rate of the market (is it expanding?)
- ✓Why now (timing catalyst)
The goal isn't to impress with big numbers. It's to prove you understand your market deeply enough to win in it.
Frequently Asked Questions
What's the minimum TAM VCs want to see?
For venture-scale, typically $1B+ TAM. But a focused $500M TAM with clear path to expansion beats an unfocused $10B TAM. Seed investors care more about SOM and early traction.
Should I use top-down or bottom-up?
Both. Show top-down for context ("The overall market is $X according to Gartner"), then bottom-up for credibility ("Here's how we calculated our serviceable market"). When they align, you win trust.
How do I size a market that doesn't exist yet?
Use adjacent markets or proxy budgets. "Companies currently spend $X on [existing solution]. We're capturing Y% of that budget." Uber sized their market using taxi + limo spend, not "ridesharing."
What if my honest TAM is small?
Show expansion potential. "TAM today is $500M. With [product expansion / geographic expansion / adjacent use case], TAM grows to $3B." VCs invest in trajectories, not snapshots.
How often do VCs actually check the sources?
Good VCs always verify. They'll Google your sources during the pitch or in due diligence. Assume everything will be checked. If you can't defend a number, don't use it.
Market sizing is just one piece of investor readiness. For the complete validation framework, read our 5-step startup validation guide.
Get Investor-Ready Market Data in 60 Seconds
TestYourIdea pulls real market sizing, competitor funding data, and demand signals automatically. The data slide every investor asks for. With sources they'll actually believe.
Get Investor Data→Free preview. Full report $19. Used by founders preparing for pre-seed.